  htwt = read.csv("http://facweb1.redlands.edu/fac/jim_bentley/Data/FYS11/HtWt.csv")
  head(htwt)
Height Weight Group
1 64 159 1
2 63 155 2
3 67 157 2
4 60 125 1
5 52 103 2
6 58 122 2Data may be imported from a local file or downloaded from the web. For this example we will use a CSV file downloaded from the web.
htwt = read.csv("http://facweb1.redlands.edu/fac/jim_bentley/Data/FYS11/HtWt.csv")
head(htwt) Height Weight Group
1 64 159 1
2 63 155 2
3 67 157 2
4 60 125 1
5 52 103 2
6 58 122 2For now, We will focus on the weight (Weight) data.
names(htwt)[1] "Height" "Weight" "Group" htwt$Weight [1] 159 155 157 125 103 122 101 82 228 199 195 110 191 151 119 119 112 87 190
[20] 87We can create a sample distribution for these data. Because the data is continuous (measured discretely) it is fairly sparse.
table(htwt$Weight)
 82  87 101 103 110 112 119 122 125 151 155 157 159 190 191 195 199 228
  1   2   1   1   1   1   2   1   1   1   1   1   1   1   1   1   1   1
It is clear that some sort of reduction of the data is needed. One method would be to group values that are “close” to each other.
To create a histogram we need to create subintervals that cover the interval between minimum and maximum. A general rule of thumb is that there should be eight to 16 of these subintervals. Sorting the data makes this easier.
 [1]  82  87  87 101 103 110 112 119 119 122 125 151 155 157 159 190 191 195 199
[20] 228
So, we need an interval that covers from 82 to 228. It would be nice if the numbers were sort of “friendly.” If we start at 75 and go to 250 using subintervals of length 25, we will use (250-75)/25 = 7 subintervals. For only having 20 observations, this seems pretty close to eight to 16.
Now we need to figure out how many observations are in each of the subintervals. We can use the table and cut functions to help us do this.
  # Put the values into subintervals
  cut(htwt$Weight, breaks=seq(75,250,25), right=FALSE)
[1] [150,175) [150,175) [150,175) [125,150) [100,125) [100,125) [100,125)
[8] [75,100) [225,250) [175,200) [175,200) [100,125) [175,200) [150,175)
[15] [100,125) [100,125) [100,125) [75,100) [175,200) [75,100)
7 Levels: [75,100) [100,125) [125,150) [150,175) [175,200) ... [225,250) # Now count how many are in each subinterval
table(cut(htwt$Weight, breaks=seq(75,250,25), right=FALSE))
 [75,100) [100,125) [125,150) [150,175) [175,200) [200,225) [225,250)
        3         7         1         4         4         0         1
We then sketch rectangles over each subinterval so that the area of the rectangle represents the number of obersvations in the subinterval.
  # Base R
  hist(htwt$Weight)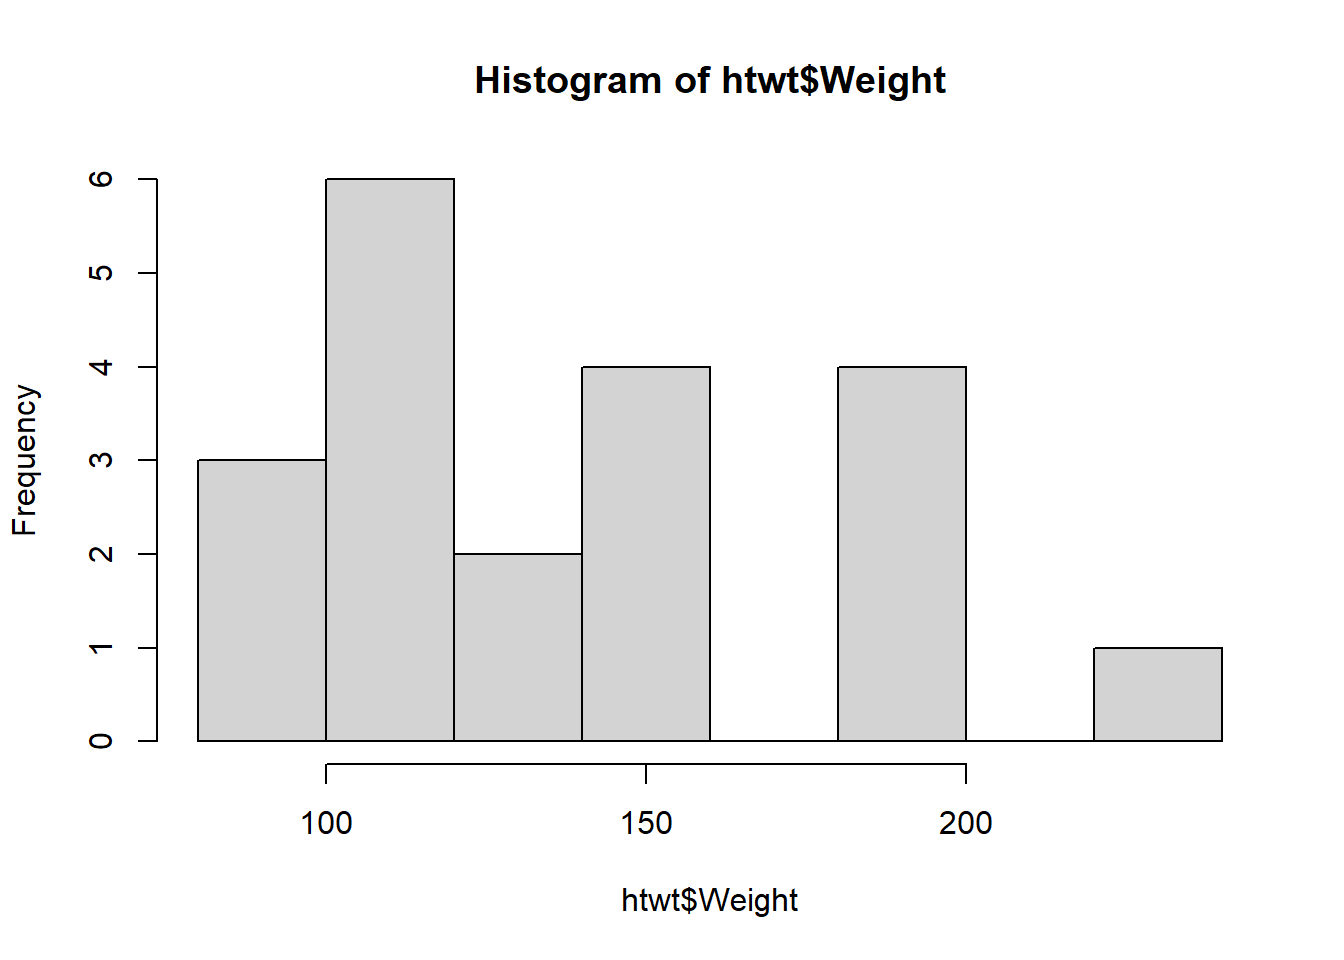
  # Lattice
  p_load(lattice)
  histogram(~Weight, data=htwt)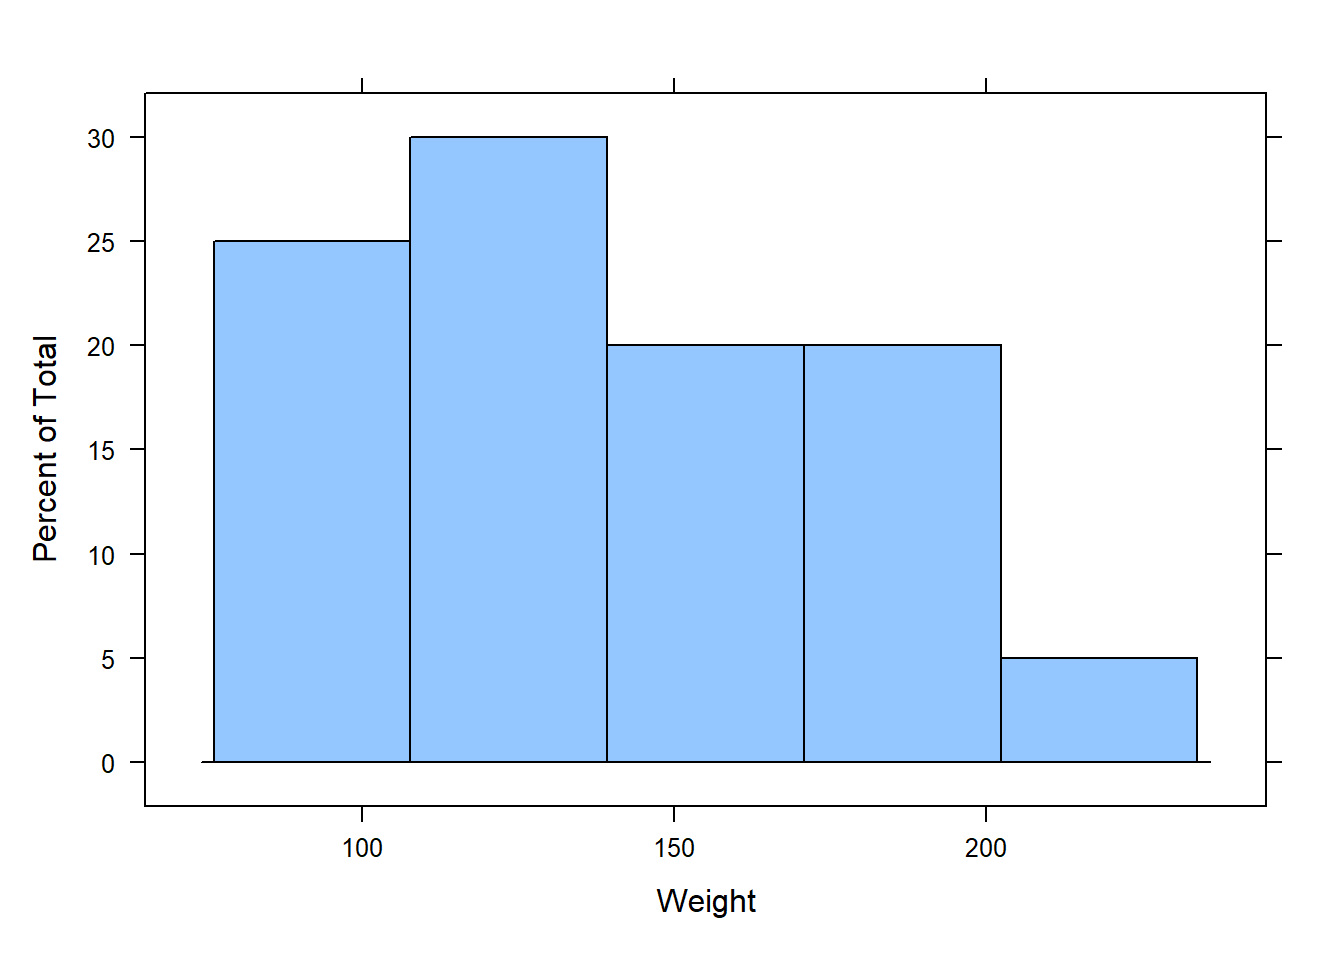
  # GGPLOT2
  p_load(ggplot2)
  ggplot(htwt, aes(x=Weight)) + geom_histogram(binwidth=20)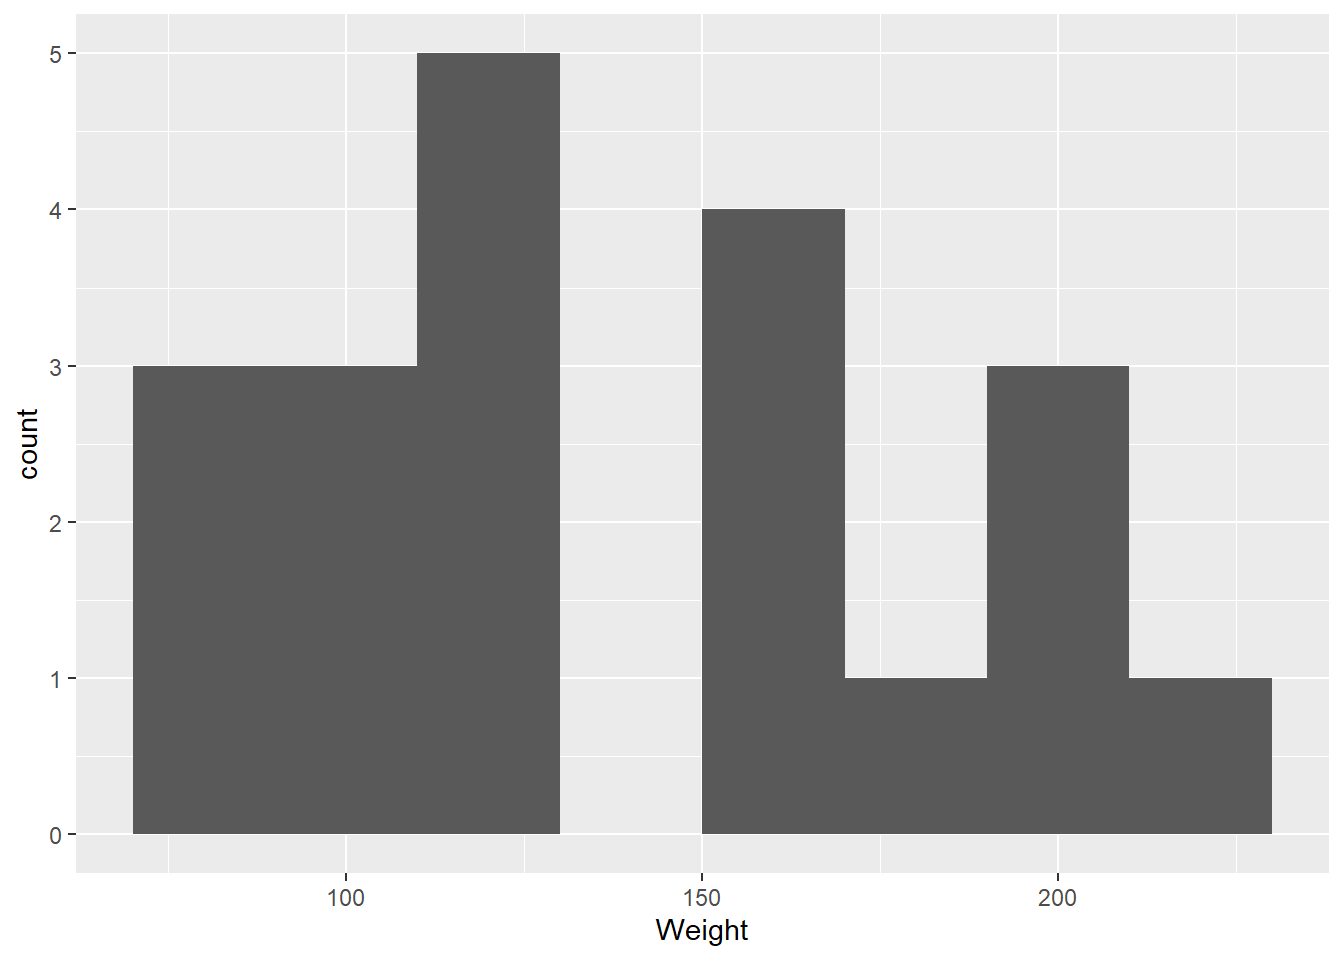
Note that to get the breaks used in the first histogram we need to use 20 pound subintervals starting at 80.
  # Put the values into subintervals
  cut(htwt$Weight, breaks=seq(80,240,20), right=FALSE)
[1] [140,160) [140,160) [140,160) [120,140) [100,120) [120,140) [100,120)
[8] [80,100) [220,240) [180,200) [180,200) [100,120) [180,200) [140,160)
[15] [100,120) [100,120) [100,120) [80,100) [180,200) [80,100)
8 Levels: [80,100) [100,120) [120,140) [140,160) [160,180) ... [220,240) # Now count how many are in each subinterval
table(cut(htwt$Weight, breaks=seq(80,240,20), right=FALSE))
 [80,100) [100,120) [120,140) [140,160) [160,180) [180,200) [200,220) [220,240)
        3         6         2         4         0         4         0         1